Standard Reports
This page gives knowledge about how to manage reports in Pitcher Insight. In Pitcher Insight you can create reports based on accrued raw information related to Business processes. These reports can be fully personalized to contain the data you need, for example the top five presentations used per month.
Creating Basic Report
Creating basic reports is simple and can be done with a few clicks.
Example: Client visits per month and time spent on slides.
To analyze how many client visits a rep did per month, proceed as follows:
Drag & drop Sales Reps to Rows, expand All reps
Drag & drop Events to Columns, click on Start Detail and select this (Start Detail = client call with CRM connection)
Drag & drop Time to Columns
(You can click Hide empty so only rows/columns that contain data are displayed)
By drilling into All times you can first view the data by year, if you drill into the year you'll see it by month, if you go further you can view it by calendar week or by day.
You can click select this on a rep to view the data for one single person. You can also click drill across and analyze according to geographical location etc. (You can also drag & drop a filter to Pages)
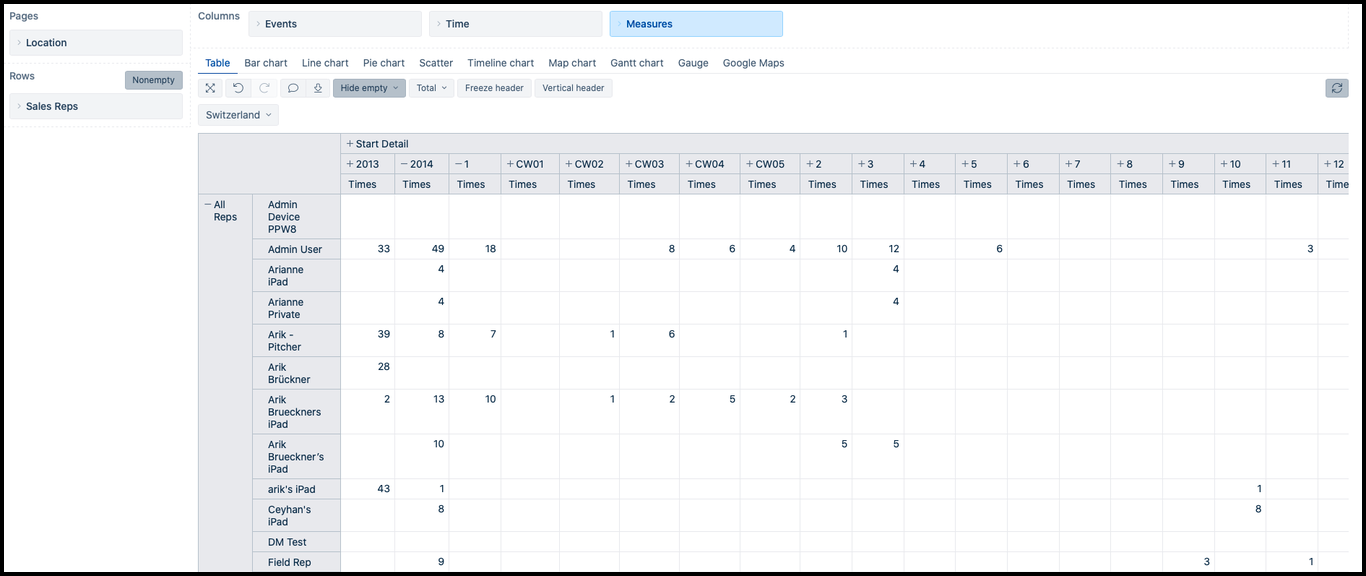
Showing how many times all reps started a client call in 2014, expanded to months, the month of may expanded to calendar week.
Example: Time spent on slides
This report is useful for presentations containing special promotions. For example, let's say the company has a special promotion on slide 7 of the Pitcher Overview presentation. We will now analyze how much time was spent on that slide per year/month. This way it's easy to find out if reps are promoting the special deals enough or not.
Drag & drop Events to Rows and Measures and Time to Columns. Select the Event View Slide (expand the events first), the Measure Durations and Time All times. Select the presentation Pitcher Overview (expand View slide first)
You now see the durations for the Exemplum presentation. Drill into All times to see data by year. Expand Pitcher Overview to see all slides, and select the one with the special promotion. This is what we're looking at:
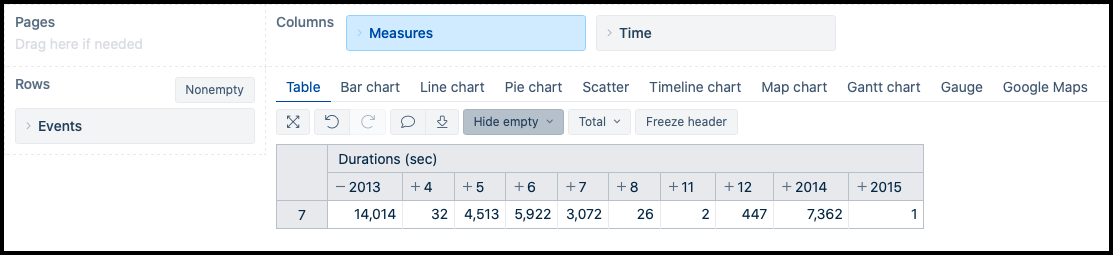
(NOTE: Irrelevant data, like the year 2012, that had duration 0, and All times, which in this case just equals the year 2013, were removed. Click Hide Empty to hide fields, i.e. Reps, with no data)
And as a bar chart:
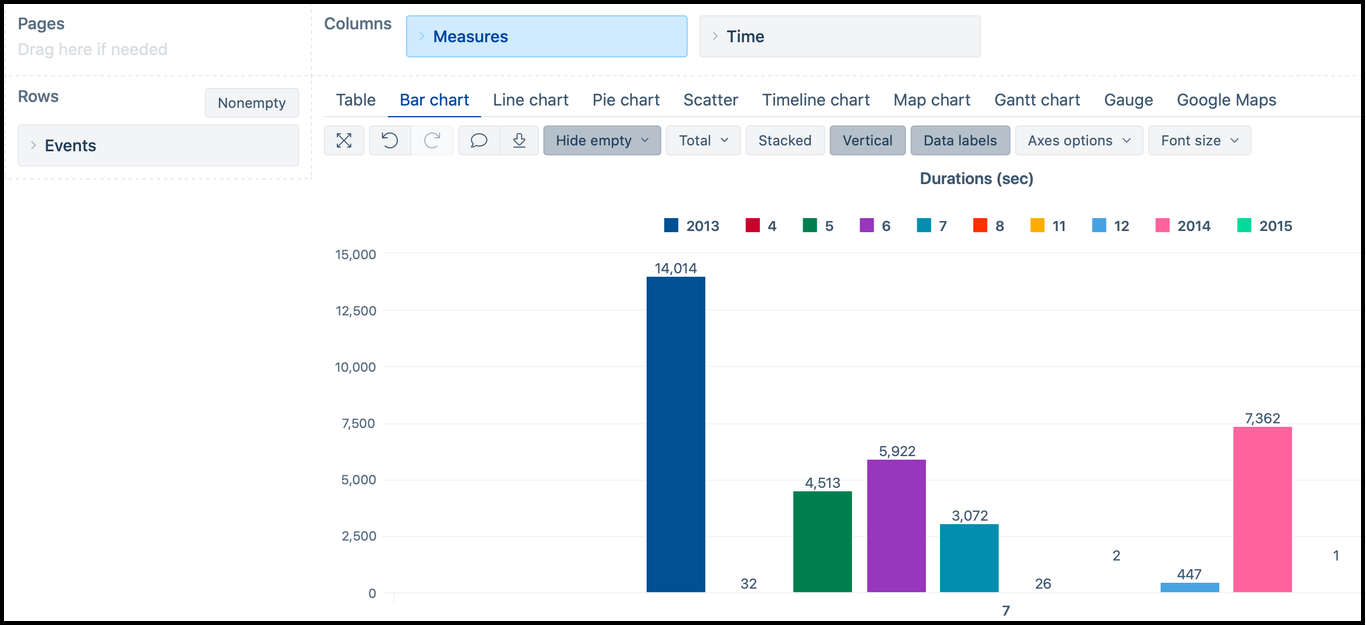
You could also drill into the next level and show data by calendar week. In this case we're analyzing a monthly special promotion, so we leave it like this. We see that the month of June (6) has longest durations on slide 7. So if that was the month of the promotion we can be sure the reps are putting emphasis on the promotion. If the promotion was in January on the other hand, the reps were doing something very wrong. Of course if we'd want to know if all reps showed the slide with more or less equal durations/which rep showed it for the longest time we can add a filter, for instance by drag & dropping Sales Reps to Pages or Rows.