Insights - Basics
This page provides knowledge about basic operations that a user can perform in Pitcher Insight. With Pitcher Insight you can create reports based on accrued raw information. You can analyze data and create flexible reports and dashboards or perform extensive analysis and insight mining. These reports can be fully personalized to contain the data you need, like for example the top five presentations used per month, content usage etc. All the analytics data for the day will be parsed overnight and will be available the next day in the Insight portal.
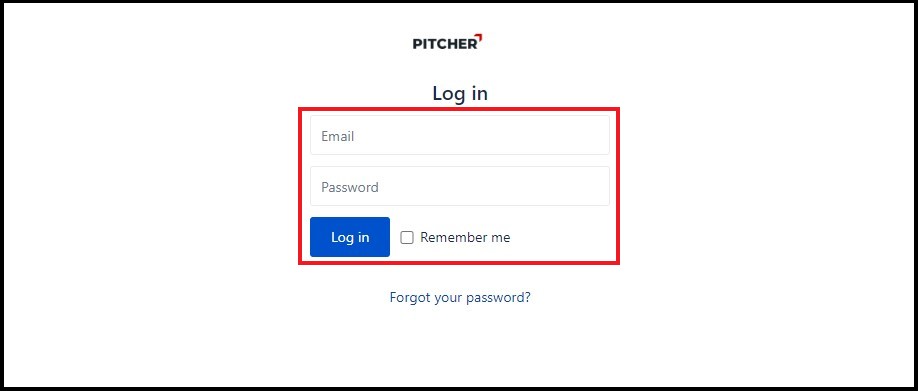
Insight Portal Login
To access Pitcher Insight simply open Pitcher Insight in your browser and log in with the provided credentials.
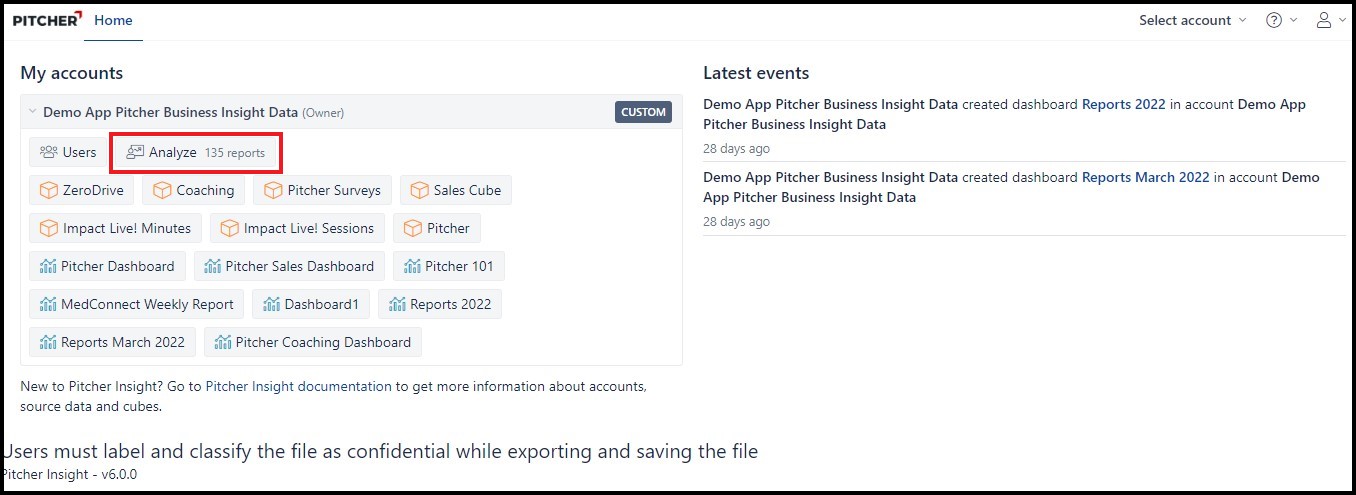
Access Reports
In order to access reports, you can click on account for which you want to see the reports under My Accounts. Then click on Analyze to access reports. Analyze contains all the cubes for which you want to see the reports. Imported data are stored in multi-dimensional data cubes. Cubes contain fact data that are divided by dimensions and each detailed fact “cell” contains measure values about that fact.
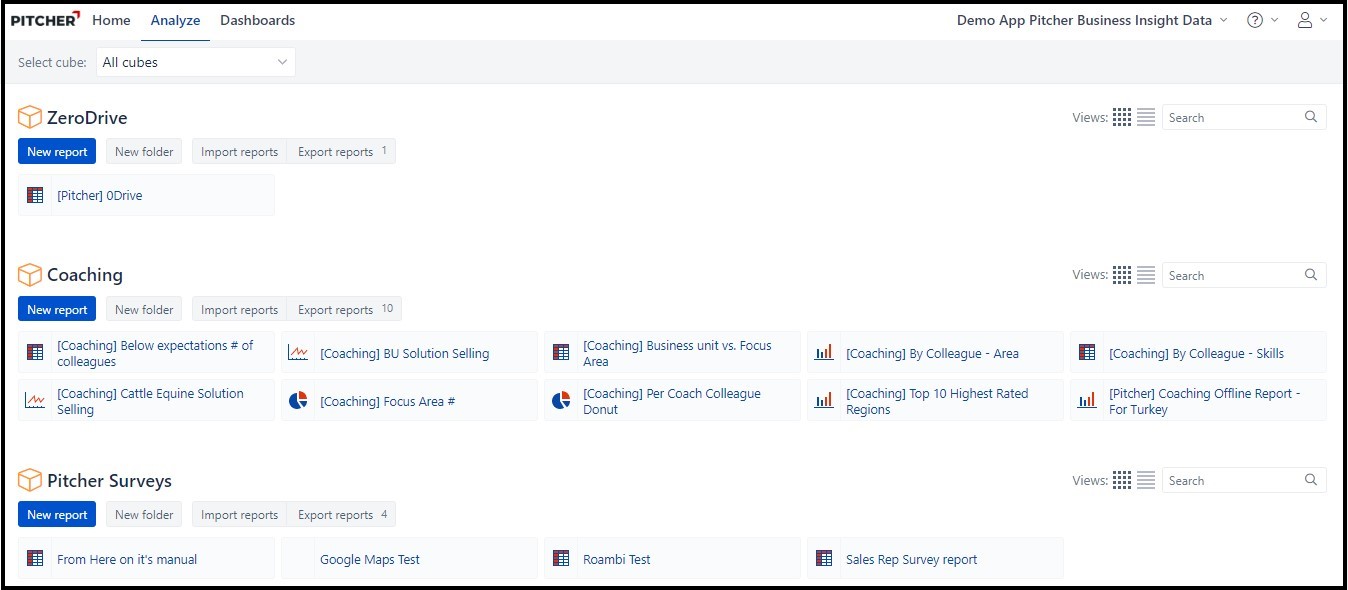
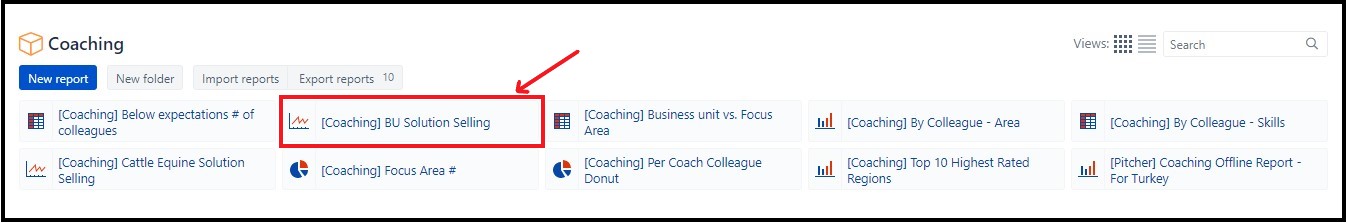
You'll find some standard reports already in each cube. Click on any report under a cube for which you want to see the report.
Creating Reports
In order to create a new report follow these steps:
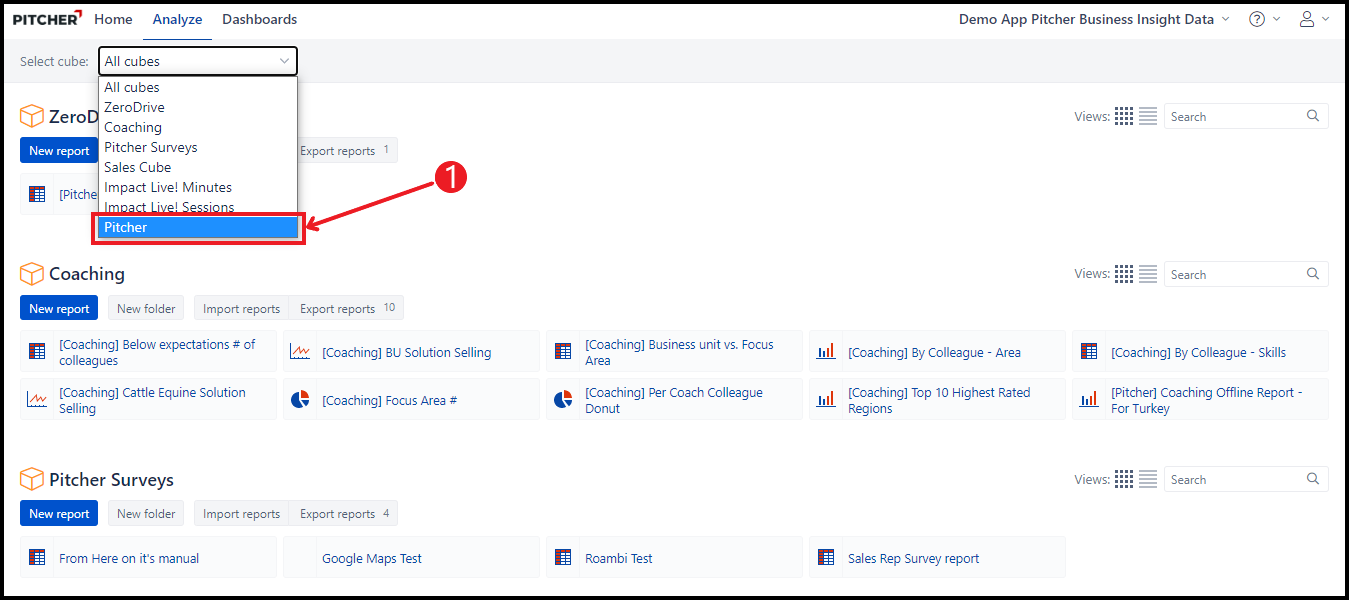
1. Select the cube for which you want to create report.
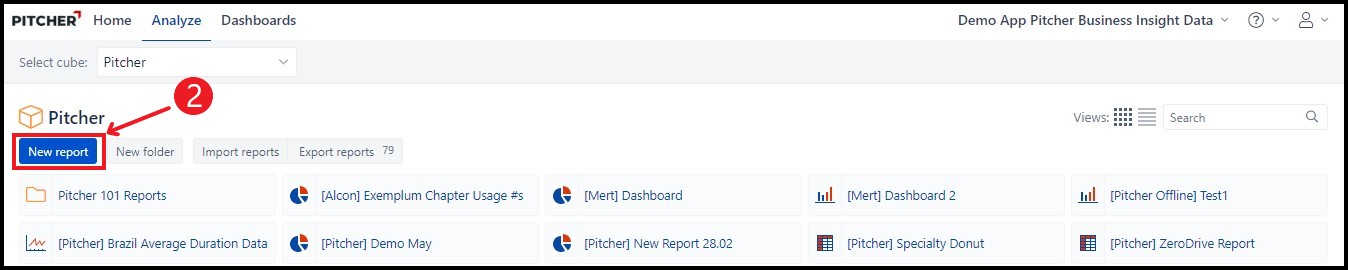
2. Click on New Report button.
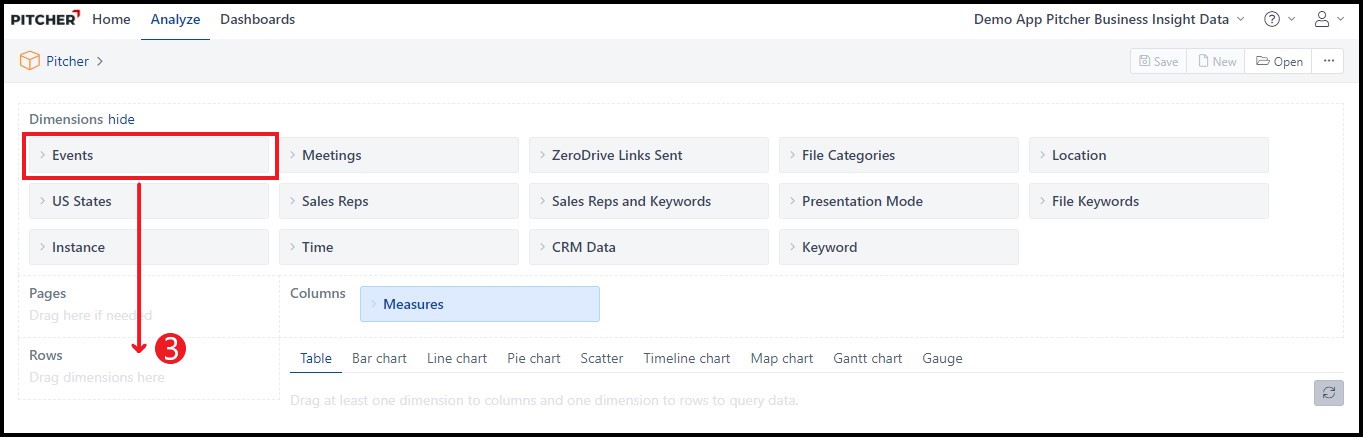
3. Select the Dimensions and drag & drop to Columns/Rows.
4. Select the Measures options. Insight will automatically create a table that you can work on.
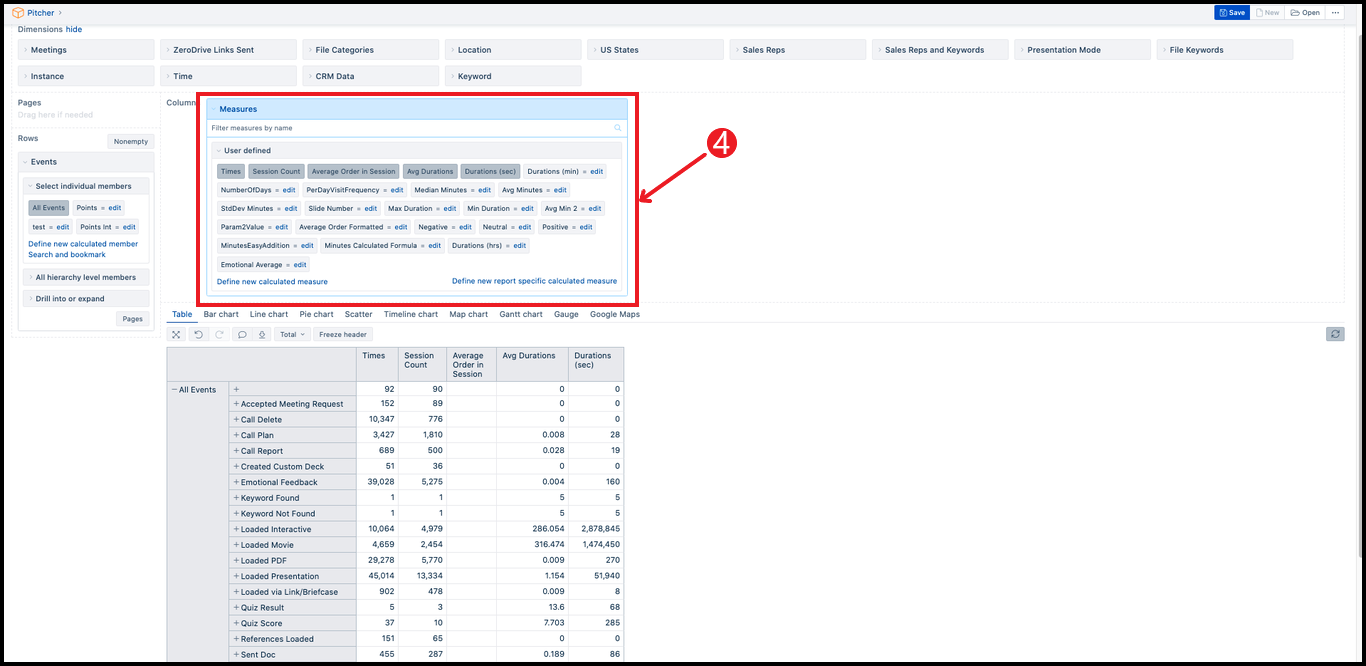
We now can see all standard Events and Measures you can analyze. You can remove/expand/select/deselect events and measures. Simply click on Times/Durations/Session Count to select/deselect. Click the + symbol to expand (=drill into) a level. If you click on an event you have further options:
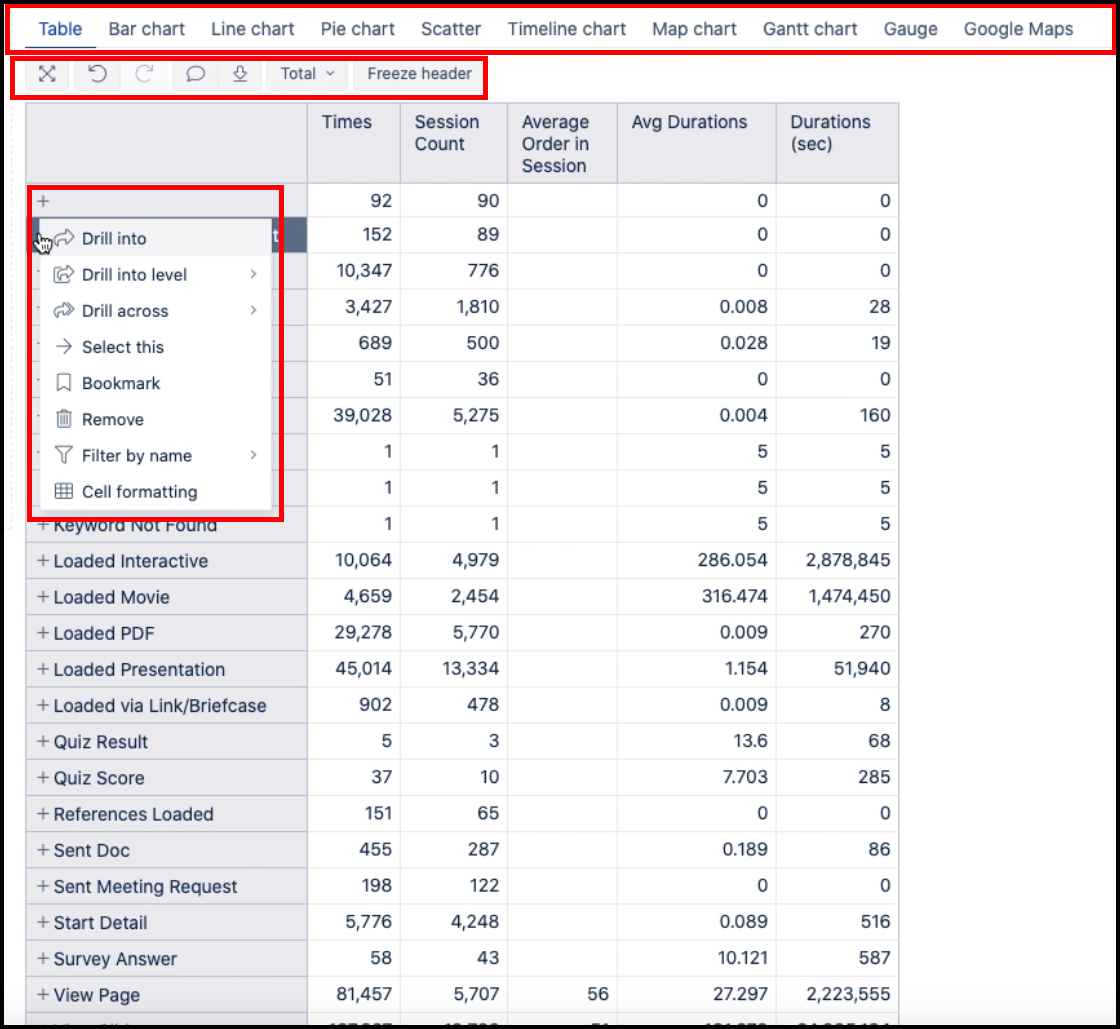
By clicking on an event you get the options Drill into, Drill into level, Drill across, Select this, Bookmark, Remove, Filter by name. The Drill into, Drill across, Select this and Remove are the most relevant options.
Drill into expands the event, same as the + symbol, and shows the next levels of the event. E.g. drill into Loaded Presentation will show you a list of all Presentations accessible in the instance. Drill across has the same effect as drag & drop more Dimensions, for instance Location or Time. If you click Select this it will show you only the data for that one selected event. Remove will delete the data for the selected event from the table
If you reload the page it will be there again, it only removes from the current table/chart, not from the system
The top bar with the different tabs gives you the options of displayable chart types. The bar below allows you to expand the report (Dimensions etc. won't be visible anymore), go one step forwards/back (arrow buttons), create a new report, open a different report, save the current report, embed the report in a HTML page and download the report to your computer (csv, xls formats for tables, csv, xls, pdf, png for charts)
Important: It will export exactly what is being currently displayed!
According to the Table/Chart you're viewing you have other options, like Hide Empty to hide fields for events that don't contain any data, Data Labels to label segments of charts, Legend to display a legend for the segments, etc. You can also drag & drop a dimension to Pages to add an additional filter to the report.
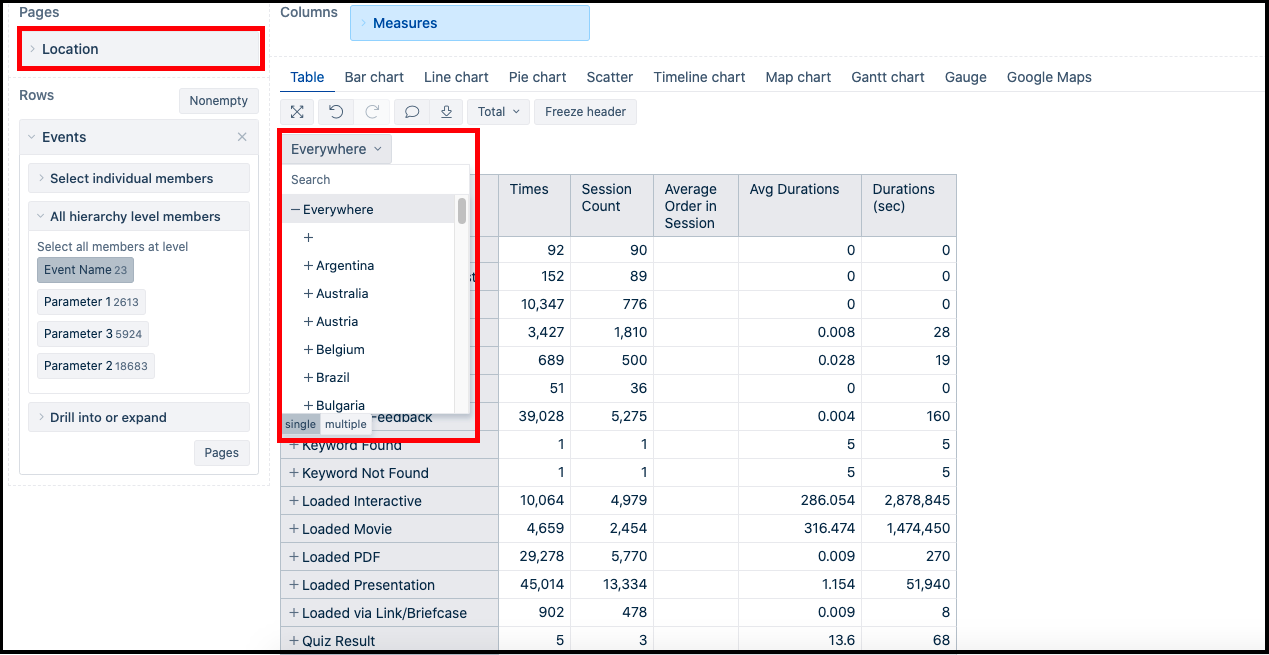
For instance drag & drop Location to Pages to filter by geographical location. You can display the data for only one country/state/city or multiple, if you click single/multiple.