Definitions: Events & Measures
This page gives knowledge on definitions of important topics in Pitcher Insight. In this article, we explain to you on a per Event, per Measure basis what they mean and what they stand for. Together with the previous article about the Basics, you should get an understanding of how to create your required report.
Measures
This is the general metric that analyzes each event and provides you with information on a per-event basis. It is crucial since Measures are part of the first step when creating a report.
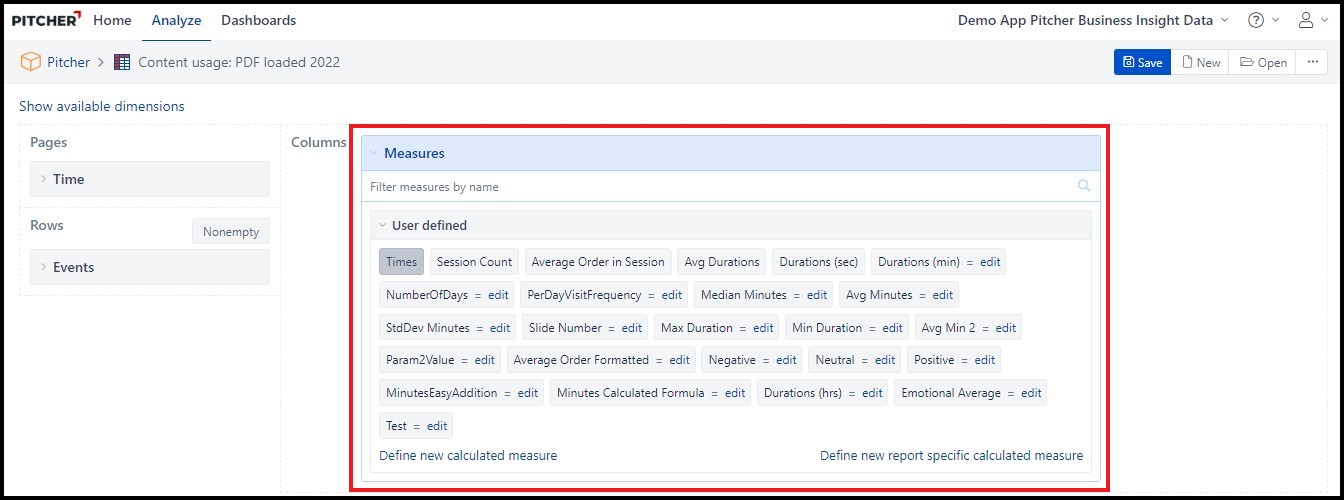
Times: This refers to how many times a certain content piece or slide has been used. Please be aware that the content type you are analyzing might have an impact on the measure.
Duration: By default, durations refer to the time spent on content in seconds. If you require this measure to be in a different format (e.g. minutes, hours, days etc.) you can make a request to update the default duration measure. Please note that durations are counted per slide (presentations) or per page (pdf), and not for the whole document.
Session Count: Number of Unique Sessions. A sessionID is reset when
- A meeting is started
- A meeting is ended
- App is fully quit and restarted with instance selection screen
- It is not reset, when switching to other apps, locking screen, showing content etc.
- It is not reset, if user quits the app during a meeting and restarts. Pitcher resumes previous sessionID after showing “do you want to resume” popup.
Example 1: User launches Pitcher on 01/01 and gets a unique sessionID A. Then starts a meeting and gets a sessionID B. Submits the meeting and returns to home screen, gets a sessionID C. In insight it’ll show as 3 sessionIDs on 01/01
Example 2: User launches Pitcher on 01/01 and keeps showing content without starting a meeting until 05/01. In insight it’ll show as 1 sessionID on 01/01, 0 on 02,03,04,05.
Example 3: User launches Pitcher on 01/01 and shows content until 02/01 and quits the app on 02/01. Then restarts 02/01. Insight will show 1 SessionID for 01/01, 1 sessionID for 02/01.
https://lucid.app/documents/view/ab087c81-2658-4f0a-a75a-590ef3da0d7e
Insider tip: SessionID is a UNIX timestamp of session start time. you can convert to date / time using https://www.unixtimestamp.com/
Number of (unique) MDs Logged In: Number of MDs who realized at least 1 event
Total Minutes Spent : Total Minutes spent subject to subscription - monthly usage limits.
Average Minutes Spent per Call : Spent minutes per call which are subject to subscription - monthly usage limits. (Total Minutes Spent / Total Number of Calls Performed)
Total Number of Attendees (HCP) : Total Number of Participants in al calls
Average Participants per Call : Average number of participants (HCPs) per call ( Total Number of Attendees (HCP) / Total Number of Calls Performed)
Total Number of Calls ID's Created: Total Number of ID Calls created within the time filter selected
Total Number of Calls Performed : Total number of realized calls - The number of calls do not count where no HCP showed up.
Number of (Unique) MDs Initiating a Call : Number of MDs who realized at least 1 call.
Total Effective Meeting Duration : Total Time spent between First HCP joins and Last HCP lefts the room
Average Effective Meeting Duration : Effective Meeting Duration per call ( Total Effective Meeting Duration/Total Number of Calls Performed)
Total Duration for All Calls : Total minutes of all calls, the duration calculated between starting and ending sessions.
Average Duration per Call : Average duration of all calls in minutes, calculated between starting and ending sessions. ( Total Duration for All Calls / Total Number of Calls Performed )
Total Preparation Duration for All Calls : Time spent from Starting the session until room's activation
Average Preparation Duration per Call : Time spent from Starting the session until room's activation per call (Total Preparation Duration for All Calls/Total Number of Calls Performed)
Examples:
If you compare Times vs. Session Count you will see how many times a respective slide or document is used within the same session which can stand for a training session or a client visit. If you use Presentation Mode in the Pages segment and select "Pitching" you will see only sessions in front of a customer. Durations, on the other hand, give you insight into how much time is spent on a certain slide/content piece.
Events
This gives you an overview of what is tracked by default within Pitcher when you upload content via the conversion engine.
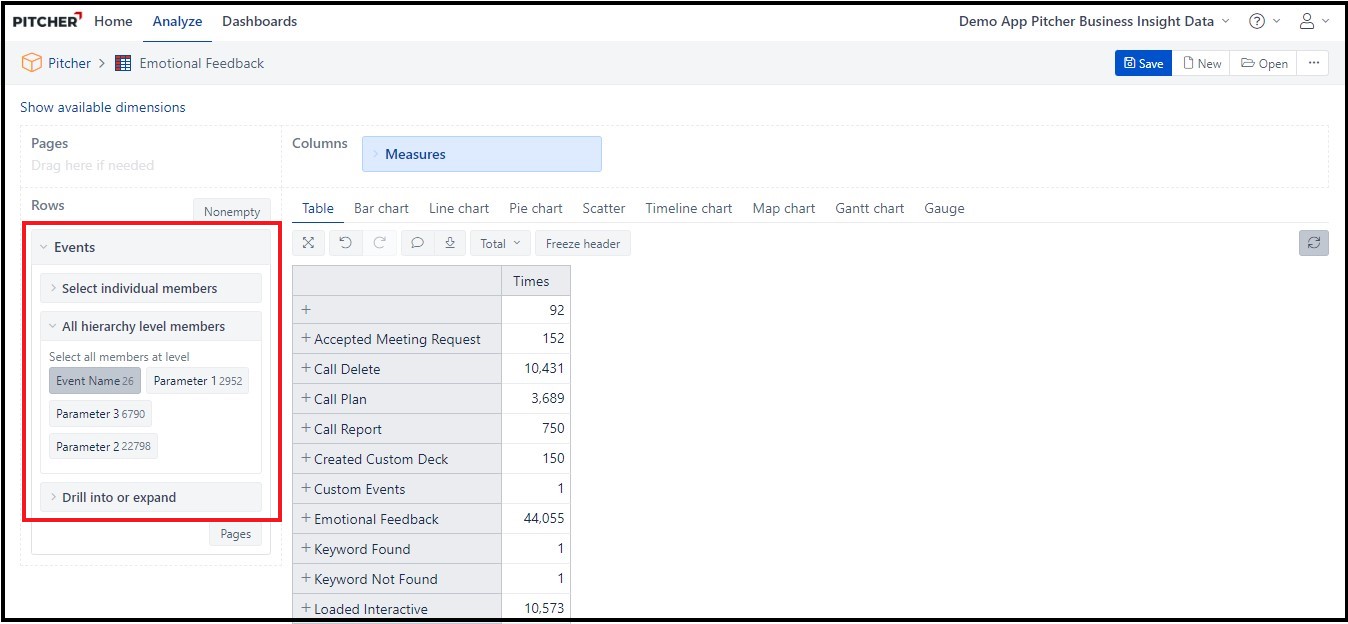
Accepted Meeting Request: How many times a Meeting Request was accepted by the Customer. Only relevant for Pitcher Connect.
Call Plan: How many times a Call was planned by creating and saving a Quick or Detailed plan call.
Call Report: How many post Call have been created and post-call is submitted.
Created Custom Deck: How many times a Custom Deck was created.
Emotional Feedback: Depending on your setup this refers to the scale from 0 to 10 where you can give points on a per slide basis either via the hidden scale (located on the left side of each slide) or depending on whether you swipe to the next slide from the top, middle or bottom of the slide.
Keyword Found: How many Keyword searches returned a result.
Keyword Not Found: How many Keyword searches did not return a result.
Loaded Interactive: Only valid in combination with Times and Session Count as Measures (that's why the others are 0) because this event counts the number of times interactive content (HTML5 developments, surveys, calculators, etc.) were used.
Loaded Movie: How many times a movie was launched
Loaded PDF: How many times a PDF was launched
Loaded Presentation: How many times a Presentation was launched
Quiz Result: In combination with an integrated LMS (e.g. Articulate Storyline) this shows how many passes/fails per Quiz
Quiz Score: Shows points earned on a per Quiz basis for integrated LMS systems
References Loaded: How many times a document set as a Reference was loaded.
Sent Doc: How many times a document was shared (takes into account Pitcher Connect and email-based sharing)
Sent Meeting Request: How many times a Meeting Request was sent. Only relevant for Pitcher Connect.
Start Detail: How many times a detail was started.
View Page: Refers to PDF pages where you can also analyze durations spent on a specific PDF document/PDF page
View Slide: Refers to presentation slides/eDetails where you can also analyze durations spent on a specific presentation/eDetail/slide
Additionally, please find below some examples of extra cubes which can be created to cover other items, providing further Events tracking functionality:
Surveys
ZeroDrive
Coaching
Sales